Music Recommendation Service With the Spotify API, Spark MLlib and Databricks
I am a huge fan of the Discovery Weekly feature of Spotify, introduced in 2015, thanks to the data provided by the start-up EchoNest, acquired by Spotify. And I am always amazed by how good their algorithm is and I am not the only one:
In this article, I will lay out how to extract songs from the Spotify API, visualize them with Spark SQL and Databricks, using Scala or Python, in the cloud for 0€/$/£, and use Spark machine learning library to create our own music recommendation service.
A quick word about Databricks, they are the team behind Apache Spark and they have built a great product around notebooks, which are Google Documents where you can execute code, to make Spark easy to use, and enhance collaboration between teams.
You can check out the code in Scala and results on this Databricks notebook.
Extract songs data from the Spotify API
As a former front-end developer, I’ve played with a lot of API, and I have to admit that the Spotify API is the best I know, thanks to its pratical API documentation where you can test their API directly inside your comfy browser.
Of course the API has its limits, literally, when requesting user’s saved tracks or playlist tracks, the output is only 50 songs top. It requires us to play with offsets to get the appropriate number of songs for our machine learning classifier.
When we extract songs from the Spotify API, we need to convert them into a Spark JSON format. Man, I love Spark but this kind of sucks, leave a comment if you have any insight about why they are doing that (EDIT: @liancheng , SparkSQL commiter, gave us a excellent answer on the why : https://medium.com/@liancheng/it-has-to-be-done-in-this-way-because-spark-processes-data-in-a-distributed-way-which-means-a-json-9f10e6d9b49a#.4mhpvs2za) :
Note that the file that is offered as a json file is not a typical JSON file. Each line must contain a separate, self-contained valid JSON object. As a consequence, a regular multi-line JSON file will most often fail.
These commands will get our songs with a curl, then transform it into the right Spark JSON format with sed. I have to admit that the one with sed was a bit tricky to create haha
curl -X GET "[https://api.spotify.com/v1/users/cpolos/playlists/4fApV392cH6iN49Fieh0Z8/tracks?limit=50&offset=](https://api.spotify.com/v1/users/cpolos/playlists/4fApV392cH6iN49Fieh0Z8/tracks?limit=50&offset=50)0" -H "Accept: application/json" -H "Authorization: Bearer $TOKEN" >> wantedSongsSpotify.json


cat wantedSongsSpotify.json | sed ':a;N;$!ba;s/\\n/ /g' | sed 's/ //g' | sed 's/}},{/}}\\n{/g' | sed -e 's/{"href":"https:\\/\\/api.spotify.com\\/v1.\*&limit=50","items":\\\[/ /g' | sed -e 's/\],"limit":50,"next":.\*,"offset":50,"previous":"https:.\*api.spotify.com.\*,"total":.\*}/ /g' > parsedSpotifySongs.json
Now, we have our songs JSON we need to get the audio features associated with them to start our algorithm.
Songs’ audio features (or variables)
Spotify API audio features documentation tells us we can obtain 9 interesting features, for example :
- acousticness : A confidence measure from 0.0 to 1.0 of whether the track is acoustic (unplugged)
- valence: A measure from 0.0 to 1.0 describing the musical positiveness conveyed by a track. Tracks with high valence sound more positive (e.g. happy, cheerful, euphoric), while tracks with low valence sound more negative (e.g. sad, depressed, angry).
In order to get these audio features we need to execute a GET on https://api.spotify.com/v1/audio-features/$trackId , when we have hundreds of songs, we need a bit of code to automatize the process. I used SparkSQL to get the trackId and a curl, you can check the details on the notebook cell called “Important Step : Extract audio features from tracks” :
getAudioFeatureAPI(sqlContext.sql("""
SELECT track.id
FROM dislikedSongsML
"""
))
result: curl -X GET "https://api.spotify.com/v1/audio-features/**$trackId\_1**" -H "Authorization: Bearer $TOKEN" >> audioFeatures.json
curl -X GET "https://api.spotify.com/v1/audio-features/**$trackId\_2**" -H "Authorization: Bearer $TOKEN" >> audioFeatures.json
These audio features are perfect to implement machine learning algorithms such as logistic or Random forest regression. We just need to label our tracks with like (1) or dislike (0)
Dataviz with Databricks display method
Once we have loaded our JSON inside Spark with Databricks, Table -> Create Table -> import file, we can use the power of SparkSQL and Databricks’s display method to mess around with our data. We can, for example, compare the Today’s top songs playlist.
This 2 pie charts below show the most frequent audio feature ranges, from 0 to 1 :
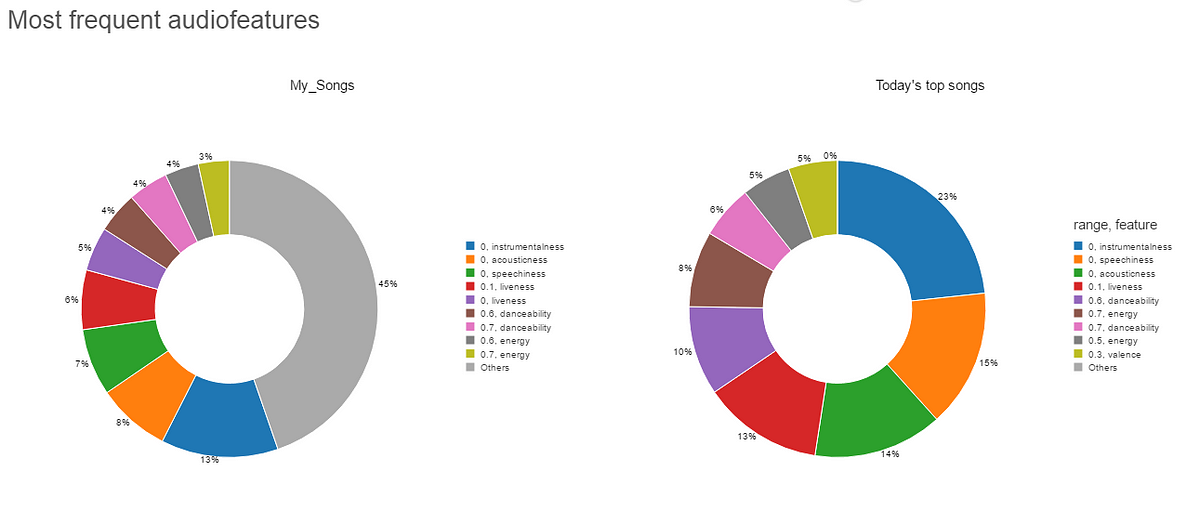
We can see that Today’s top songs tend to have the same audio features, while my songs seem to have a wider range, look at the gray color representing others audio features ranges that cannot fit into the pie chart!
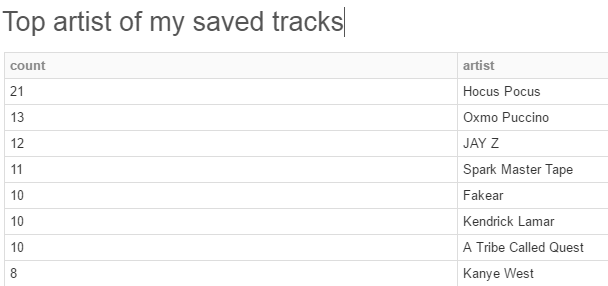
Also, we can use (Spark) SQL to see from whom I have the most songs saved from.
display(sqlContext.sql("""
SELECT COUNT(\*) as count, items.track.artists\[0\].name as artist
FROM itemsParsed
GROUP BY items.track.artists\[0\].name
HAVING count > 3
ORDER BY count DESC
"""
))
By the way, if you feel clueless about how to organize your music into themed playlists, Spotify offers a great tool to do so : http://static.echonest.com/OrganizeYourMusic/
Correlation between audio features
So let’s get back to our recommendation algorithm ! As we are going to use 9 audio features, we can see how they correlate between them with Spark.
Correlation measures the degree, from -1 to 1, to which 2 phenomena are related to each other. A positive correlation is the number of ice creams sales and heat, where as a negative correlation is the relationship between sport and weight.
Once we got all audio features for all tracks, we can use the “Statistics.corr” function of Spark to get our results:
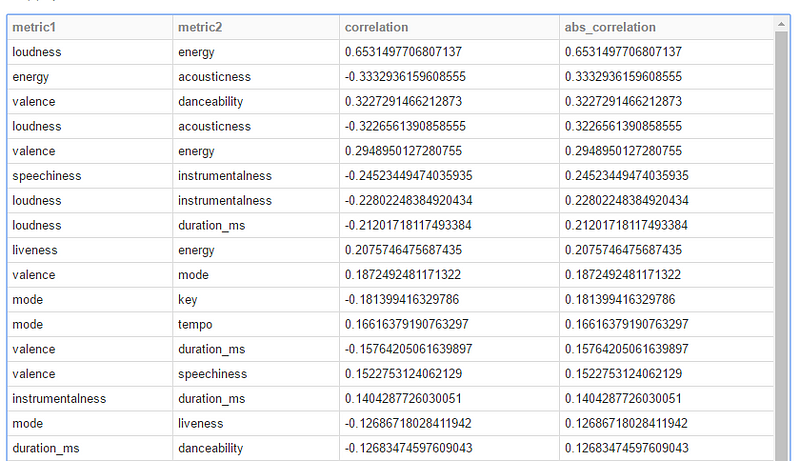
Energy and loudness has a 0.65 degree of correlation, it means that the more loud is a song, the more energy it will have. Where as, loudness and acousticness has a -0.22 degree, it means the louder a song is, the less acoustic it will be.
EchoNest does a great job, audio features do not correlate, except for loudness and energy with a 0.65 correlation degree.
If 2 audio features correlate, it would not be useful to select both of them, as they would depend on the same attribute. If we keep 2 audio features with a high degree of correlation, it can affect our recommendation service negatively, as the attribute behind this audio feature, will affect our result more.
Keep always in mind, that correlation does not equal causation.
Logistic regression
Now that we have our tracks with their audio features. We can label them with like, 1, and add others we don’t like with 0 to use a machine learning classifier.
A logistic regression is a model that predicts 0 (dislike) or 1 (like), the dependant variable, based on an array of variables, called predictive features or explanatory variables.
Like = y-Intercept + coefficient1 X (audio_feature1) + … + coefficientN X (audio_featureN)
Spark provides a awesome high-level API to go straight to our goal with a few lines.
We init our logistic regression with parameters
**val** lr = **new** LogisticRegression()
  .setMaxIter(500) //same result from 100 to 10K because we have few features
 .setElasticNetParam(1) //result get better the closer to 1
 .setRegParam(0.0) //result get better with 0 (default value), otherwise gives always "like"
We train our classifier with our training data (songs we like and dislike)
lr.fit(songs)
We observ what are our regression model coefficients and intercept:
- danceability, how suitable a track is for dancing: 4.10
- energy, perceptual measure of intensity and activity.: 3.15
- speechiness, detects the presence of spoken words in a track: 2.36
- instrumentalness, predicts whether a track contains no vocals.: 1.71
- acousticness : 1.33
- liveness, the presence of an audience in the recording: 0.35
- mode, the modality (major or minor): -0.31
- valence, the musical positiveness: -0.2
- loudness, The overall loudness of a track in decibels: -0.15
- tempo, beats per minute: 0.005
- key: 0.06
What about our intersect you will tell me? Here it is -6.97!
We test unknown songs
lr.transform(testSongs)
If we test one of my favorite artists, 20Syl, playlist “discovery” songs are highly recommended (72 out of 89), that’s a good sign !
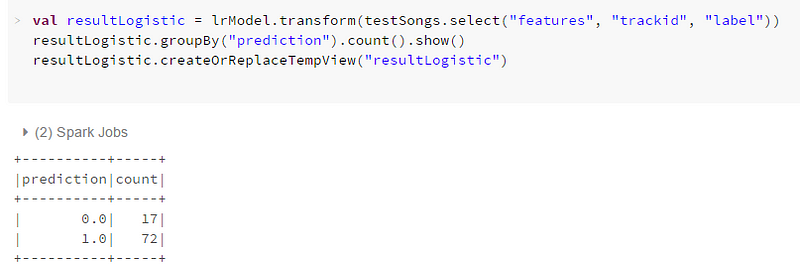
But.. Wait! Have we just out-brained Spotify Discover weekly feature with a few SparkML lines? I think so… not haha :)
Let’s try with a… hmm… let’s say not my usual type of songs : death metal
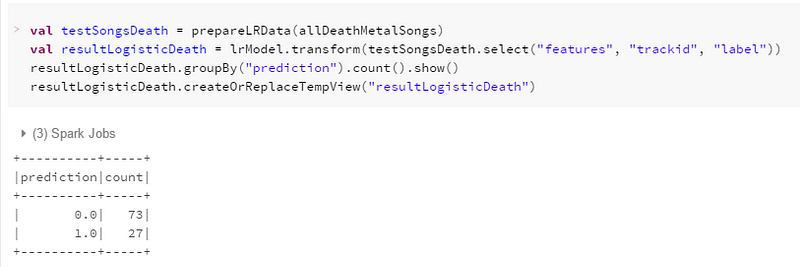
Our recommendation system recommends 27 out of 100 death metal songs. According to my taste it should recommend 0, but I might be wrong haha I should give the recommended songs a try sometimes!
Possible improvements
We could add more disliked songs, as there are only 100 of them, against 700 for the liked ones.
Also, we could use a more fitted algorithm for our use case, the random forest regression, it will be presented in another article :)
Try it yourself! Import my notebook inside your Databricks account and have fun with SparkSQL or SparkML !
Sources
- Try Databricks for free: https://databricks.com/try-databricks
- Organize your Spotify music with EchoNest and audio features : http://static.echonest.com/OrganizeYourMusic/#
- If you feel adventurous, you can use this lib to have almost the same result as Databricks’ display method: https://github.com/vegas-viz/Vegas
- This blog article’s Databricks notebook : https://databricks-prod-cloudfront.cloud.databricks.com/public/4027ec902e239c93eaaa8714f173bcfc/6937750999095841/1043779841828769/6197123402747553/latest.html
- Naked Statistics from Charles Wheelan
Special Thanks
Nicolas Duforêt, PhD Data scientist @Tabmo , an AdTech company based in Montpellier and Paris, for his advices
Justine Mouron, Engineer based in LA for her review